🇫🇷 Lire en Français | 🇪🇸Leer en Español | 🇧🇷Leia em português
A breeder called me last month. Twenty years in Golden Retrievers. She’d been calculating COI for every litter since 2008. But here’s what she said: “I run the numbers religiously, I just don’t know what they actually mean.”
That confession matters. Because if you’re making breeding decisions based on a metric you don’t truly understand, you’re navigating by a compass whose north you’ve never questioned.
For a decade, I believed pedigree-based COI was sufficient. The industry told us: calculate the number, keep it under 10%, proceed with confidence. Then genomic testing arrived—DNA-based diversity measurements that promised to revolutionize breeding decisions. My initial assumption? These were simply the evolved version of pedigree COI. That we should abandon the old metric entirely.
I was wrong.
Here’s what the data actually reveals: pedigree COI and genomic diversity are not redundant tools. They are complementary instruments measuring fundamentally different dimensions of genetic reality. The pedigree number tells you what should exist based on documented breeding records. The DNA measurement tells you what actually exists in your dog’s genome.
Sometimes these numbers align. Often, they diverge dramatically. And that divergence—that gap between expectation and reality—reveals hidden genetic architecture that determines whether your breeding program builds toward sustainability or collapses under accumulated genetic debt.
- TL;DR: Key Takeaways
- What’s the Difference Between These Two Numbers?
- How Do You Actually Use Both Numbers When Breeding?
- What Tools Do You Actually Need?
- What Warning Signs and Success Signals Should You Track?
- Red Flag #1: Metric Discordance (Low Pedigree COI, Low Genomic Diversity)
- Red Flag #2: Popular Sire Saturation
- Red Flag #3: Misinterpreting “Clear” Health Panels as “Genetic Health”
- Success Metric #1: Consistent Achievement of COI Targets
- Success Metric #2: Genomic Diversity Scores Improving Across Generations
- Success Metric #3: Offspring Demonstrate Superior Health, Longevity, and Soundness
- Success Metric #4: Sustained Access to Unrelated Breeding Candidates
- The Truth Lives in the Integration
TL;DR: Key Takeaways
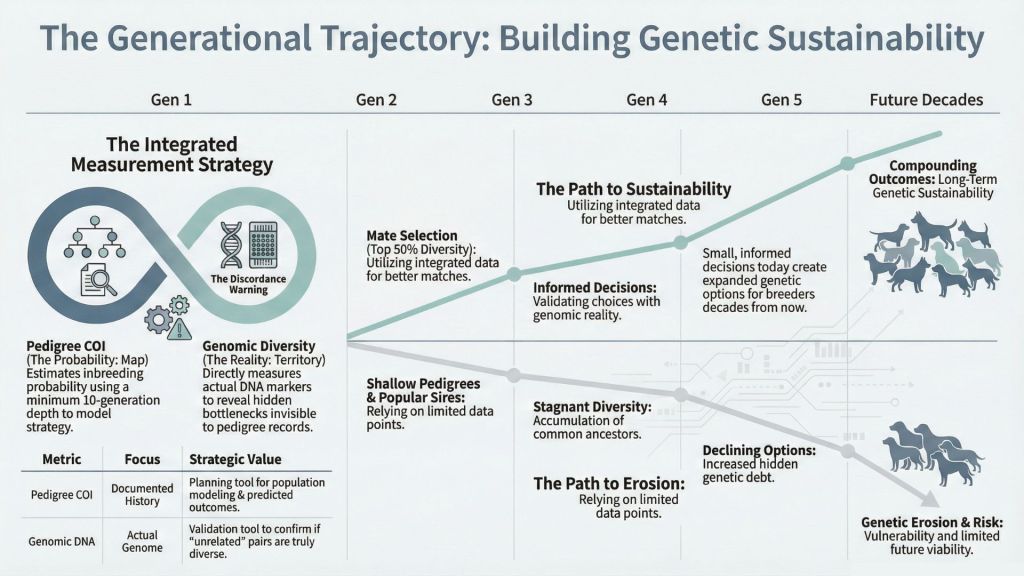
- Pedigree COI estimates probability—it calculates what should exist based on documented ancestors, but remains blind to genetic events before your records began
- Genomic diversity measures reality—DNA testing reveals what actually exists in your dog’s genes, capturing all inbreeding including ancient bottlenecks your pedigree cannot see
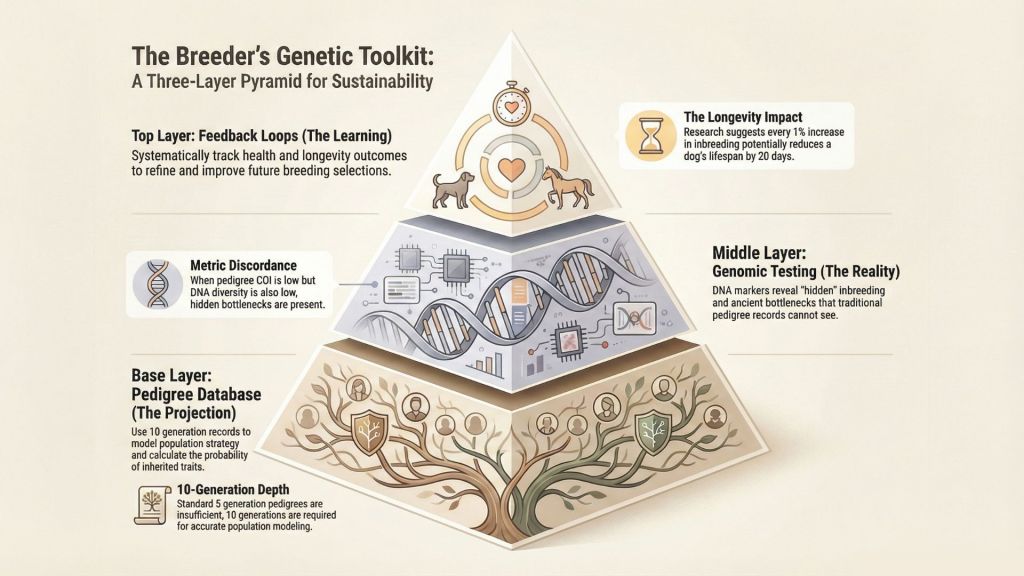
- Discordance signals hidden architecture—when pedigree shows low COI but DNA shows low diversity, you’ve discovered ancient bottlenecks that your breeding records cannot capture
- Both metrics serve distinct purposes—use 10-generation pedigree COI for population modeling and breeding strategy, then validate with genomic testing to assess individual genetic reality
- Practical targets drive decisions—maintain pedigree COI below 10% (ideally below 5%) while selecting mates in the top half of breed diversity rankings
- The integration reveals truth—your pedigree describes the map you followed; your genome reveals the territory you actually inhabit
What’s the Difference Between These Two Numbers?
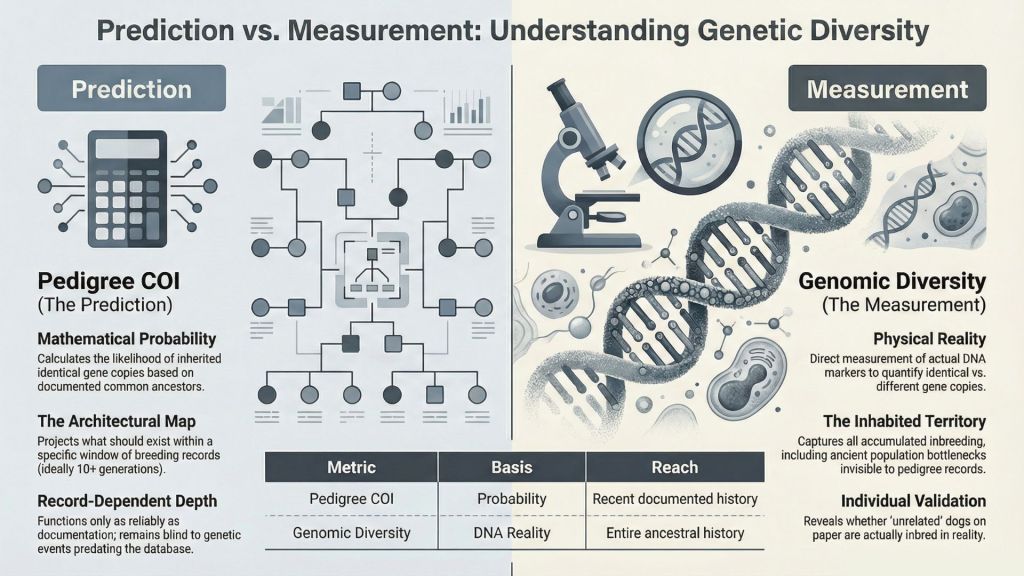
Let’s establish foundational clarity. COI—Coefficient of Inbreeding—is a percentage representing genetic sameness. Higher numbers signal concentrated ancestry. Lower numbers suggest genetic breadth. Simple enough. But here’s where most breeders stumble: there are two distinct methods for calculating this number, and they measure fundamentally different realities.
This isn’t semantic splitting. This is architecture versus archaeology—planning versus discovery.
Pedigree COI: The Calculated Projection
Pedigree COI is mathematical probability. You enter parents into your database. The software identifies common ancestors—dogs appearing on both maternal and paternal lines. It calculates the likelihood that offspring inherited identical gene copies from that shared ancestor.
Think of it as predictive modeling based on documented breeding decisions. If your dog’s great-great-grandfather appears on both sides of the pedigree, statistical probability suggests your dog carries duplicated genetic material from that ancestor. The COI percentage estimates how much of that duplication occurred across the entire pedigree.
| What Pedigree COI Reveals | What It Cannot See |
| Inbreeding from documented ancestors in your records | Genetic events predating your database |
| Recent breeding decisions (5-10 generation window) | Ancient bottlenecks in breed foundation |
| Known common ancestors you can trace | Undocumented relationships beyond record depth |
| Planning tool: predicted offspring COI | Actual genetic reality in individual animals |
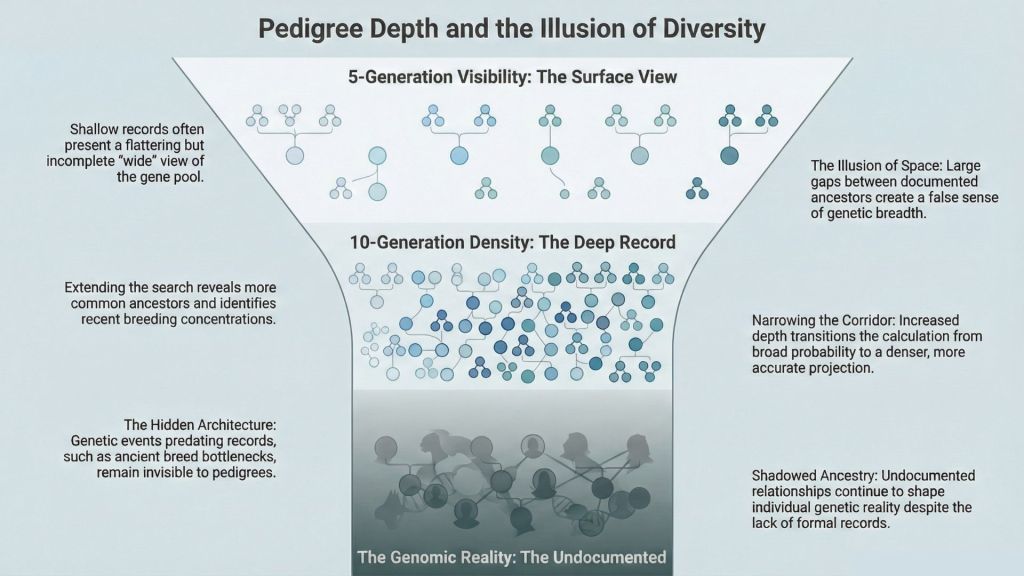
The critical limitation: Research by Calboli and colleagues demonstrated that pedigree COI functions only as reliably as your documentation. If your breed descended from 20 founders in 1920 but your database begins in 1980, all that foundational concentration remains invisible. Your pedigree COI appears reassuringly low while your breed carries substantial genetic debt.
Most breeders default to 5-generation calculations. Fast. Convenient. Flattering. Fundamentally insufficient.
A 5-generation pedigree COI consistently underestimates reality. You need minimum 10-generation depth to approximate true inbreeding—though even that misses founding bottlenecks if your breed originated from a restricted gene pool.
Genomic Diversity: The Measured Reality
DNA diversity testing is direct measurement, not mathematical projection. These tests analyze your dog’s actual genetic code. They examine thousands of specific DNA locations (SNP markers—genetic checkpoints scattered across chromosomes) and quantify how many positions show two identical gene copies versus two different copies.
Identical copies equal inbreeding. Different copies equal diversity. The test aggregates across thousands of markers and returns either a diversity score or genomic COI percentage.
| What DNA Diversity Reveals | Why This Matters |
| Actual genetic sameness in the individual | This measures reality, not probability |
| All accumulated inbreeding across entire breed history | Captures hidden concentration your pedigree misses |
| True genetic diversity available for breeding | Determines whether this dog helps or harms your program |
| Validation: did your breeding strategy succeed? | Reveals whether “unrelated” dogs are actually inbred |
The power of genomic measurement: it captures everything. Ancestry documented in your pedigree? Measured. Ancient founders never recorded? Still measured. Common ancestors from 50, 80, 100 generations ago? All reflected in the DNA reality.
This explains why studies across 227 dog breeds found genomic COI often runs 2-3 times higher than pedigree-based calculations suggest. Your pedigree database reports 5% (acceptable). DNA testing reveals 15% (concerning). That 10-percentage-point gap represents hidden genetic history—concentration your records cannot show but your dog definitely inherited.
Why Discordance Matters (And What It Reveals)
Here’s the critical insight: these two numbers measure different dimensions of the same genetic reality.
Pedigree COI answers: “Based on documented breeding, what inbreeding should this dog carry?”
Genomic diversity answers: “Based on actual DNA, what inbreeding does this dog carry?”
When these answers align—excellent. Your records run deep and accurate. You possess clear vision into genetic health.
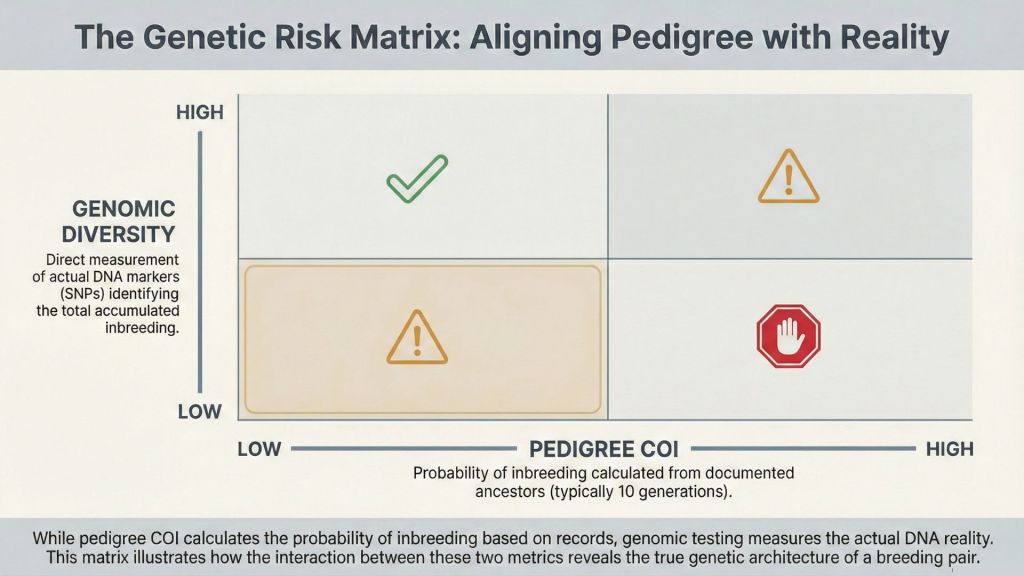
When these answers diverge—when pedigree shows low COI but DNA shows low diversity—you’ve uncovered critical hidden architecture. It signals that your supposedly unrelated parents share substantial genetic history your pedigree cannot reveal. Your breed experienced severe bottlenecks (compression to very few breeding animals) at some historical point, and every contemporary dog carries that concentrated foundation.
| Scenario | Interpretation | Strategic Response |
| Low pedigree COI (under 8%) + High DNA diversity (top 40% of breed) | Alignment confirmed—records accurate, dog shows good diversity | Continue current breeding strategy |
| Low pedigree COI (under 8%) + Low DNA diversity (bottom 30% of breed) | Hidden bottleneck revealed—pedigree incomplete | Seek dogs from different populations/geographic origins |
| High pedigree COI (over 12%) + Low DNA diversity | Both metrics confirm excessive inbreeding | Strongly reconsider breeding this individual |
| Moderate pedigree COI (8-12%) + Moderate DNA diversity | Proceed with caution—test potential mates | Choose mate with high diversity to balance |
According to Optimal Selection’s 2024 breeding guidelines, you cannot substitute one metric for the other. They function as complementary instruments. Your pedigree maps breeding strategy. Your DNA test validates genetic outcome. Both are necessary. Neither is sufficient alone.
In clinical practice, I observe breeders who rely exclusively on pedigree calculations making breeding decisions on incomplete information. Like navigating by stars when GPS exists. Traditional, yes. Reliable, no—not when your celestial map only shows recent constellations while ancient gravitational forces shape your actual trajectory.

How Do You Actually Use Both Numbers When Breeding?
Knowledge without application remains theoretical. Understanding the distinction between pedigree and genomic metrics matters only when it transforms your breeding decisions. Here’s the systematic protocol.
Step 1: Calculate 10-Generation Pedigree COI (Not 5)
Most breeders default to 5-generation calculations. Convenience. Speed. Flattering numbers. All insufficient.
A 5-generation pedigree COI consistently masks deeper inbreeding architecture. You need minimum 10-generation depth. Use dedicated pedigree software—Kintraks, ZooEasy—or access your breed club’s multi-generation database.
The strategic purpose: Pedigree COI functions primarily as a population modeling tool, not an individual assessment instrument. When you examine 10 generations, you identify:
- Popular sires whose genetic contribution saturates the breed
- Founder lines that disappeared through genetic drift
- Breeding decisions that incrementally concentrated inbreeding
- Which bloodlines retain meaningful differentiation versus cosmetic variation
| Target Range (10-Generation) | Interpretation | Action Protocol |
| Under 5% | Exceptional—minimal documented relatedness | Ideal for foundation pairings or diversity expansion |
| 5-8% | Acceptable—manageable inbreeding level | Proceed if other metrics support |
| 8-12% | Caution threshold—elevated risk territory | Proceed only with genomic validation |
| Over 12% | Red flag—excessive documented inbreeding | Reconsider pairing; seek alternative mates |
Strategic principle: Before contacting any stud dog owner, calculate hypothetical pedigree COI. If it exceeds 10%, conserve your time and explore different genetic contributions. Your goal: maintain each generation at or below your breed’s current average. You cannot immediately reverse decades of accumulated inbreeding, but you can halt further erosion.
Step 2: Order Genomic Testing for Both Proposed Parents
After identifying matings that appear acceptable on paper (pedigree COI within target range), validate your projections through genomic reality. Order DNA diversity testing for both potential parents.
Your primary testing options:
| Testing Platform | What You Receive | Strategic Value |
| Embark for Breeders | Genomic COI percentage, diversity percentile vs breed population, 250+ health variant screening, pairing comparison tool | Comprehensive integration of diversity + health data |
| MyDogDNA / Optimal Selection | Diversity index, genomic COI, breed-wide distribution graphs, breeder networking capacity | Strong population-level visualization |
| UC Davis VGL | STR-based diversity measurement, DLA immune haplotype typing | Particularly valuable for rare breeds or bottleneck recovery programs |
Consider the framework: you’re purchasing insurance against producing a litter carrying concentrated genetic risk, placing puppies who develop early-onset health complications, or further compromising your breed’s genetic foundation. The testing expense prevents problems whose resolution costs multiples more—financially, emotionally, reputationally.
Interpretation framework: Each platform reports diversity differently, but all compare your dog to breed population distributions. Target: top half of the distribution—above 50th percentile, ideally above 60th. If both parents score favorably, proceed. If one or both rank in the bottom 30%, pause and reconsider your mate selection.
| Parent DNA Diversity Ranking | Interpretation | Breeding Protocol |
| Both parents above 50th percentile | Good population-level diversity | Proceed with mating |
| One parent 30-50th percentile, one above 50th | One parent pulls diversity downward | Consider alternative mate with higher diversity |
| One or both below 30th percentile | Low diversity—significant genetic risk | Seek completely different bloodlines |
| Both below 20th percentile | Critical risk threshold | Do not breed this pairing |
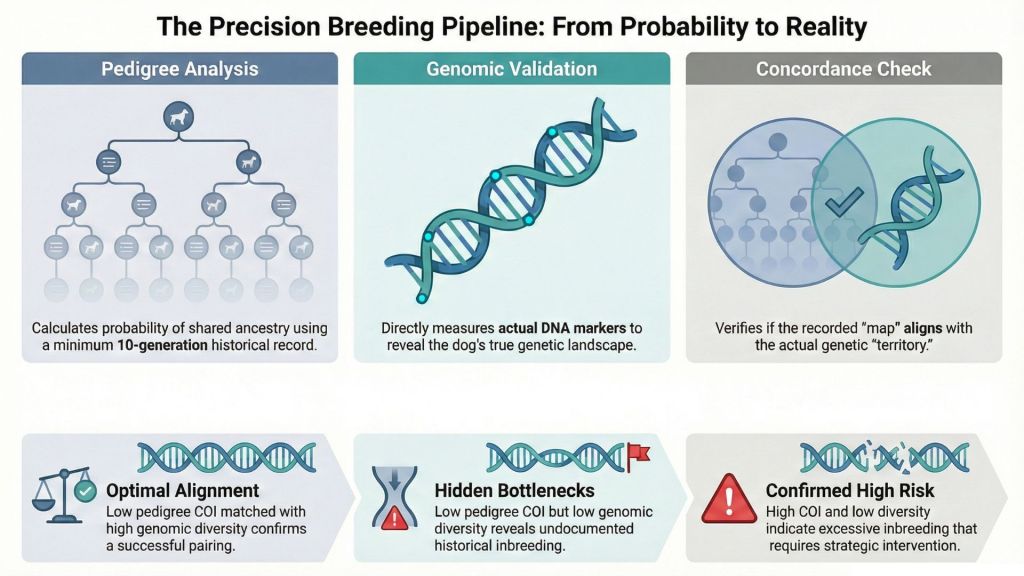
Step 3: Evaluate Concordance Between Metrics
You now possess both data dimensions: pedigree projection and genomic reality. Assess whether they align or diverge.
Scenario A: Concordance (both metrics favorable)
Pedigree COI calculates 6%. Both parents rank 55th and 62nd percentile for genomic diversity. This alignment signals:
- Your pedigree database runs deep enough to be reliable
- These dogs demonstrate genuine unrelatedness beyond superficial bloodline differences
- You can proceed with confidence
Scenario B: Discordance (low pedigree COI, low genomic diversity)
Pedigree COI calculates only 4%—seemingly unrelated. Genomic testing reveals both parents rank 15th and 22nd percentile for diversity. This discordance is your critical warning signal. It indicates:
- Your “unrelated” dogs share substantial genetic history beyond pedigree documentation
- Your breed experienced severe historical bottleneck(s)—compression to very few breeding animals
- Even careful avoidance of recent inbreeding cannot overcome ancient genetic architecture
Response protocol when metrics conflict:
Don’t proceed with breeding simply because pedigree numbers appear acceptable. DNA reveals genetic truth. Instead:
- Seek males from geographically distant populations (imported lines, different continental breeding traditions)
- Explore currently unfashionable bloodlines not trending in your region
- Consider dogs lacking show credentials but demonstrating strong genomic diversity
- Engage with breed club diversity initiatives or structured outcross programs
Scenario C: Dual confirmation of high inbreeding
Pedigree COI measures 13%. Both parents rank 18th and 25th percentile for genomic diversity. Both instruments confirm: this represents high-risk breeding. Unless extraordinary circumstances justify proceeding (conservation breeding of critically endangered bloodline), seek different genetic contributions.
| Pedigree COI | Genomic Diversity | Strategic Interpretation | Protocol |
| Low (under 8%) | High (top 40%) | Excellent concordance | Breed with confidence |
| Low (under 8%) | Low (bottom 30%) | Hidden bottleneck revealed | Find more diverse mate from different population |
| Moderate (8-12%) | High (top 40%) | DNA shows better reality than pedigree | Monitor offspring; genomic reality favorable |
| Moderate (8-12%) | Low (bottom 30%) | Both metrics warn | Reconsider mating; diversity worse than it appears |
| High (over 12%) | Any level | Excessive documented inbreeding | Seek substantially less related pairing |
Step 4: Document Outcomes and Establish Feedback Loops
After breeding, maintain rigorous records. This transforms individual breeding decisions into cumulative program intelligence.
Document for each litter:
- 10-generation pedigree COI
- Both parents’ genomic diversity rankings
- Health complications manifesting in offspring (structural, temperamental, immune-mediated)
- Breeding stock retained or placed in established breeding programs
- Long-term outcomes as puppies mature to adulthood
The iterative improvement cycle: Over successive generations, patterns emerge. Perhaps offspring from high-diversity parents consistently demonstrate superior hip scores. Perhaps matings appearing acceptable on paper but carrying hidden genetic concentration (low DNA diversity) produce elevated rates of environmental allergies or behavioral anxiety. This accumulated intelligence refines your selection criteria with each breeding cycle.
As I discussed in my article on litter size genetics, genetic decisions compound across generations. One well-informed decision produces healthier dogs, which expands your breeding options in the next generation, which enables even more robust genetic outcomes. It’s a virtuous cycle—but only if you systematically track the data that reveals which decisions succeeded and which failed.
What Tools Do You Actually Need?
Infrastructure precedes insight. You cannot manage genetic architecture without measurement systems. But you also needn’t invest thousands in sophisticated software to begin making informed decisions. Here’s the essential toolkit, organized by priority and function.
Priority 1: Pedigree Database (The Historical Record)
Function: Stores multi-generation ancestry, calculates COI across temporal depth, enables modeling of hypothetical matings before commitment.
| Tool | Optimal Application |
| Kintraks | Most breeds; intuitive interface design |
| ZooEasy | Multi-species capacity; suitable for diversified breeders |
| Breed club database | Breed-specific; integrates titles and health clearances |
| Online COI calculators | Quick calculations; limited analytical depth |
The strategic value: Your pedigree database functions as planning infrastructure. Before initiating contact with any stud dog owner, you model potential pairings and assess projected COI. You identify which founders appear repeatedly in population pedigrees (genetic saturation points). You determine which bloodlines maintain meaningful differentiation versus superficial variation.
Consider it analogous to financial record-keeping in business operations. You wouldn’t operate a breeding program without tracking genetic assets and liabilities any more than you’d operate a business without monitoring capital flow.
Implementation principle: When entering pedigrees, maximize generational depth within your data constraints. Greater historical depth yields proportionally greater analytical utility.
Priority 2: Genomic Testing (The Validation Instrument)
Function: Analyzes actual DNA to quantify true genetic diversity and inbreeding level, independent of pedigree documentation.
| Testing Platform | Deliverables |
| Embark for Breeders | Genomic COI percentage, diversity percentile vs breed, 250+ health variant screening, coat genetics, pairing comparison tool |
| MyDogDNA / Optimal Selection | Diversity index, genomic COI, breed population distribution visualization, breeder networking capacity (Optimal Selection tier) |
| UC Davis VGL Diversity Panel | STR-based diversity measurement, DLA immune haplotype typing; particularly valuable for rare breeds or bottleneck recovery |
Reframe the analysis: you’re purchasing insurance against producing litters carrying concentrated genetic risk, placing puppies who develop early-onset complications, or further compromising breed genetic foundation. The testing investment prevents problems whose resolution—financial, emotional, reputational—costs exponentially more.
Cost management protocol: You needn’t test every dog in your program. Test the dogs you’re seriously evaluating for breeding. If you’re considering three potential sires for your female, test all four animals and leverage that data for final mate selection. The testing investment prevents potential costs in downstream health complications and reputational damage.
Priority 3: Record-Keeping Architecture (Often Underestimated)
Function: Aggregates all breeding decisions, test results, and outcomes in centralized location enabling pattern recognition across generations.
| System | Optimal For |
| Spreadsheet (Google Sheets, Excel) | DIY breeders; requires disciplined maintenance |
| Dedicated breeding software (multiple options available) | Serious programs; automates calculations and reporting |
The compounding value: Your breeding program improves across generations only through systematic learning from each breeding cycle. Did high-diversity pairings produce healthier offspring? Did that imported sire improve your program’s genetic foundation or not? You cannot answer these questions without rigorous record architecture.
Minimum viable system: At bare minimum, maintain a spreadsheet containing:
- Litter date
- Sire identification + pedigree COI + genomic diversity ranking
- Dam identification + pedigree COI + genomic diversity ranking
- Offspring count
- Health screening outcomes for puppies you monitor long-term
- Observations regarding temperament, structure, complications
What Warning Signs and Success Signals Should You Track?
Infrastructure without oversight degrades. You’ve established measurement systems, you’re quantifying genetic metrics, you’re documenting breeding decisions. Now you need diagnostic criteria—the red flags demanding intervention and the success signals confirming your strategy works.
Red Flag #1: Metric Discordance (Low Pedigree COI, Low Genomic Diversity)
The pattern: Pedigree COI calculates 3-5% (appears favorable). Genomic testing reveals both parents rank bottom 25% of breed population (decidedly unfavorable).
The interpretation: Your breed harbors hidden genetic bottleneck(s) beyond pedigree documentation. At some historical juncture—perhaps 50, 80, 100 years ago—your breed compressed to a very small founding population. Every contemporary dog descends from that restricted genetic base, rendering them more closely related than pedigrees suggest.
The risk: You believe you’re breeding unrelated animals while genetically you’re concentrating shared ancestry. You’re amplifying genetic complications without awareness.
| Warning Threshold | Pedigree COI | Genomic Diversity Percentile | Required Action |
| 🟢 Green zone | Under 8% | Both parents above 40th percentile | Proceed—metrics align favorably |
| 🟡 Yellow zone | Under 8% | One parent below 30th percentile | Select alternative, more diverse mate |
| 🔴 Red zone | Under 8% | Both parents below 25th percentile | Critical mismatch—seek entirely different bloodlines |
| 🔴 Red zone | Over 12% | Any percentile | Pedigree alone demonstrates excessive inbreeding |
The protocol: Don’t proceed with breeding simply because pedigree numbers appear acceptable. Prioritize genomic reality. Seek dogs from geographically distant populations—imported lines, different continental breeding traditions, bloodlines currently unfashionable in your region.
Red Flag #2: Popular Sire Saturation
The pattern: A male wins prestigious competitions, achieves top-sire recognition, dominates social media visibility. Suddenly numerous breeders in your region pursue that male for breeding.
The mechanism: This represents the “popular sire effect”—one of the most destructive forces in breed genetic health. Even if that individual demonstrates genetic excellence, using him in 5%, 10%, or 20% of all breedings floods the gene pool with his genetic contribution (favorable alleles and deleterious ones alike).
The long-term consequence: Two or three generations later, you cannot identify breeding candidates unrelated to that popular sire. Your breeding options contract dramatically. Any genetic complications he carried—including ones not yet manifesting phenotypically—become widespread in the breed population.
| Usage Frequency | Population Impact | Long-Term Trajectory |
| Under 2% of litters | Healthy contribution level | One line among many; diversity maintained |
| 5% of litters | Approaching saturation threshold | Beginning to appear ubiquitously in pedigrees |
| 10%+ of litters | Popular sire effect operational | Genetic diversity collapsing; future options severely constrained |
The discipline required: Resist the temptation toward fashionable bloodlines. Seek males demonstrating strong diversity rankings who lack current prestige. Your offspring may not carry the prominent pedigree name, but they’ll possess superior genetic foundation—and that differential compounds across generations.
Red Flag #3: Misinterpreting “Clear” Health Panels as “Genetic Health”
The pattern: Your dog tests clear for 200 genetic disorders on a DNA panel, creating confidence that genetic health requirements are satisfied.
The limitation: DNA health panels exclusively test for simple Mendelian disorders (conditions caused by single gene mutations). They entirely miss the major welfare burdens in dogs—hip dysplasia, cardiac disease, epilepsy, cancer, anxiety—which are polygenic (caused by many genes interacting in complex ways).
The danger: You breed a dog demonstrating low genetic diversity because it’s “clear” on all health tests, then observe offspring developing hip complications, allergic conditions, or behavioral disturbances. Those complex health issues connect directly to inbreeding and low diversity, but they don’t appear on simple DNA disease panels.
| Health Condition | Genetic Architecture | DNA Panel Detection? | Diversity Connection? |
| Progressive Retinal Atrophy | Simple Mendelian | ✅ Yes | Not directly correlated |
| Von Willebrand’s Disease | Simple Mendelian | ✅ Yes | Not directly correlated |
| Hip Dysplasia | Polygenic/complex | ❌ No | ✅ Yes—exacerbated by inbreeding |
| Cardiac Disease | Polygenic/complex | ❌ No (usually) | ✅ Yes—exacerbated by inbreeding |
| Immune-Mediated Disorders | Polygenic/complex | ❌ No | ✅ Yes—exacerbated by inbreeding |
| Anxiety/Fear Behaviors | Polygenic/complex | ❌ No | ✅ Yes—exacerbated by inbreeding |
The perspective shift: Employ DNA health panels as one instrument among many, but don’t allow them to generate false confidence. A dog with excellent diversity but carrier status for one simple disorder often represents a superior breeding prospect compared to a dog clear for all tested disorders but demonstrating terrible diversity rankings.
Success Metric #1: Consistent Achievement of COI Targets
The standard: Every litter you produce maintains 10-generation pedigree COI below 10%, ideally below 8%, optimally below 5% for foundation pairings.
The significance: You’re preventing genetic diversity erosion through “COI creep”—the insidious pattern where each generation becomes incrementally more inbred until the breed reaches crisis threshold.
| Your Breed’s Average COI | Your Target Per Litter | Strategic Goal |
| Under 5% | Maintain below 5% | Preserve exceptional diversity |
| 5-10% | Maintain at or below breed average | Halt further erosion |
| 10-15% | Target 8-10% or lower | Actively reverse trajectory |
| Over 15% | Target 10-12% or lower | Aggressive diversity restoration required |
The implementation: Before every breeding, model projected COI. If it exceeds your threshold, identify different mate. Demonstrate willingness to decline a titled champion if a less-decorated dog yields superior COI projection.
Success Metric #2: Genomic Diversity Scores Improving Across Generations
The standard: The offspring you produce rank higher for genetic diversity than their parents. Across 2-3 generations, your program’s average diversity percentile climbs measurably.
The significance: This confirms your breeding decisions function as intended. You’re not merely maintaining diversity—you’re actively restoring it.
The tracking protocol: Maintain simple generational comparison:
- Generation 1 (foundation stock): Average parent diversity = 35th percentile
- Generation 2: Average parent diversity = 42nd percentile
- Generation 3: Average parent diversity = 51st percentile
If your metrics trend upward, you’re succeeding. If they plateau or decline, your breeding decisions aren’t producing intended outcomes and require strategic reassessment.
Success Metric #3: Offspring Demonstrate Superior Health, Longevity, and Soundness
The standard: The dogs you produce:
- Pass health screenings (hips, elbows, ophthalmological, cardiac) at rates exceeding breed averages
- Reach ages 10, 12, or beyond while maintaining activity and quality of life
- Exhibit stable, confident temperaments
- Don’t develop early-onset health complications
The significance: Genetic diversity isn’t abstract theory—it directly influences health outcomes and lifespan. Research demonstrates that each 1% increase in COI potentially costs approximately 20 days of lifespan. Lower inbreeding correlates with longer, healthier lives.
The feedback architecture: Maintain systematic contact with puppy buyers at 6 months, 1 year, 2 years, and beyond. Query specific outcomes:
- Any structural diagnoses?
- Any behavioral concerns?
- Any chronic health conditions?
- General quality of life assessment?
Document outcomes by litter in spreadsheet format. Across time, patterns emerge revealing which pairings produced the healthiest, longest-lived offspring—those represent your genetic success stories to replicate.
Success Metric #4: Sustained Access to Unrelated Breeding Candidates
The standard: When planning your next breeding, you can identify multiple potential mates demonstrating minimal relatedness to your dog. You maintain optionality.
The significance: In breeds experiencing severe genetic bottlenecks, breeders eventually encounter constraint where every potential mate shows close relationship. “I cannot identify a male unrelated to my female” signals your breed’s gene pool has contracted excessively. Maintaining breeding options indicates genetic health.
| Scenario | Interpretation | Prognosis |
| You can identify 5+ potential mates with pedigree COI under 8% | ✅ Excellent—genuine choice maintained | Continue diverse breeding strategy |
| You can identify 2-3 potential mates with COI under 10% | ⚠️ Options narrowing progressively | Exercise strategic discipline avoiding popular sire saturation |
| You cannot identify any mate with COI under 12% | 🚨 Gene pool crisis threshold | Consider importing, outcrossing, or breed club diversity intervention |
The Truth Lives in the Integration
Here’s what matters: Your pedigree describes the breeding architecture you designed. Your genome reveals the genetic reality you manifested. Sometimes these align perfectly—your strategic mate selection produced precisely the diversity expansion you projected. More often, they diverge—your seemingly unrelated pairing still generated concentrated genetic architecture because hidden bottlenecks operated beyond your pedigree’s temporal horizon.
Breeders who build sustainable programs across decades employ both instruments in concert. They calculate 10-generation pedigree COI to avoid compounding documented inbreeding and to model population-level breeding strategy. Then they validate those projections through genomic testing to confirm they’re achieving genuine genetic diversity in offspring, not merely satisfying themselves with favorable-appearing pedigree numbers.
This integrated approach isn’t more complex than single-metric breeding—it’s more intellectually honest. You’re acknowledging that your documented ancestry records don’t capture the complete genetic history embedded in your dogs, and that contemporary DNA measurement can illuminate what historical records cannot.
You already possess the foundational capacity to begin. Calculate deeper pedigrees (10 generations minimum, not 5). Test the dogs you’re genuinely considering for breeding. Compare both metrics and adjust strategy when they diverge. Document outcomes systematically so each generation teaches you something that improves the next.
The dogs you’ll breed five years hence will demonstrate superior health, extended longevity, and greater resilience—direct consequences of the genetic decisions you implement today. Every time you prioritize genetic diversity over trendy bloodlines, you invest in your breed’s sustainable future. Every time you pause when metrics conflict and seek more appropriate genetic contributions, you prevent complications before they manifest.
That’s responsible breeding. Making decisions grounded in complete information architecture, not partial visibility. Breeding with clarity, not in the dark.